
 Yahoo Lifestyle
 The 4.8% return this week takes Ally Financial's (NYSE:ALLY) shareholders five-year gains to 180%
The worst result, after buying shares in a company (assuming no leverage), would be if you lose all the money you put in. But on a lighter note, a good company can see its share price rise well over 100%. Long term Ally Financial Inc. (NYSE:ALLY) shareholders would be well aware of this, since the stock is up 150% in five years. It's even up 4.8% in the last week.
The past week has proven to be lucrative for Ally Financial investors, so let's see if fundamentals drove the company's five-year performance.
View our latest analysis for Ally Financial
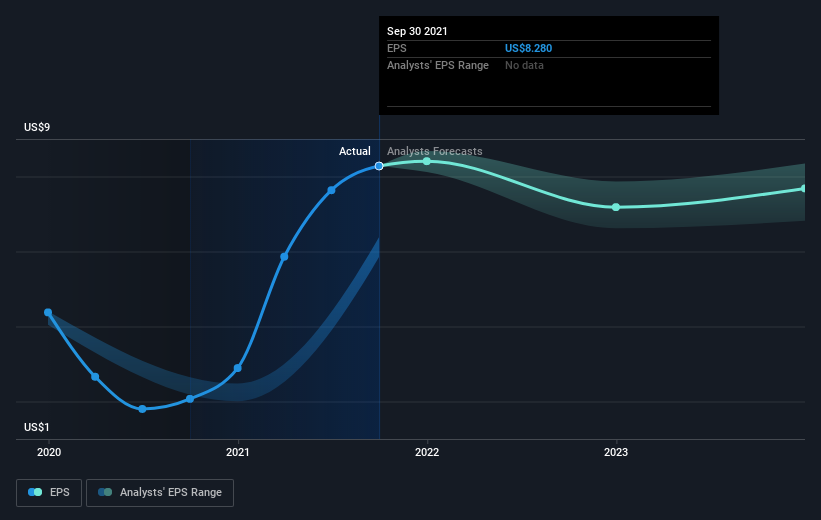
While markets are a powerful pricing mechanism, share prices reflect investor sentiment, not just underlying business performance. One way to examine how market sentiment has changed over time is to look at the interaction between a company's share price and its earnings per share (EPS).
During the last half decade, Ally Financial became profitable. That kind of transition can be an inflection point that justifies a strong share price gain, just as we have seen here. Since the company was unprofitable five years ago, but not three years ago, it's worth taking a look at the returns in the last three years, too. Indeed, the Ally Financial share price has gained 102% in three years. Meanwhile, EPS is up 49% per year. This EPS growth is higher than the 26% average annual increase in the share price over the same three years. Therefore, it seems the market has moderated its expectations for growth, somewhat. This unenthusiastic sentiment is reflected in the stock's reasonably modest P/E ratio of 5.64.
You can see how EPS has changed over time in the image below (click on the chart to see the exact values).
We know that Ally Financial has improved its bottom line over the last three years, but what does the future have in store? Take a more thorough look at Ally Financial's financial health with this free report on its balance sheet.
What About Dividends?
When looking at investment returns, it is important to consider the difference between total shareholder return (TSR) and share price return. The TSR is a return calculation that accounts for the value of cash dividends (assuming that any dividend received was reinvested) and the calculated value of any discounted capital raisings and spin-offs. So for companies that pay a generous dividend, the TSR is often a lot higher than the share price return. In the case of Ally Financial, it has a TSR of 180% for the last 5 years. That exceeds its share price return that we previously mentioned. This is largely a result of its dividend payments!
A Different Perspective
It's good to see that Ally Financial has rewarded shareholders with a total shareholder return of 36% in the last twelve months. And that does include the dividend. That gain is better than the annual TSR over five years, which is 23%. Therefore it seems like sentiment around the company has been positive lately. Someone with an optimistic perspective could view the recent improvement in TSR as indicating that the business itself is getting better with time. I find it very interesting to look at share price over the long term as a proxy for business performance. But to truly gain insight, we need to consider other information, too. Even so, be aware that Ally Financial is showing 2 warning signs in our investment analysis , and 1 of those is a bit concerning...
If you would prefer to check out another company -- one with potentially superior financials -- then do not miss this free list of companies that have proven they can grow earnings.
Please note, the market returns quoted in this article reflect the market weighted average returns of stocks that currently trade on US exchanges.
Have feedback on this article? Concerned about the content? Get in touch with us directly. Alternatively, email editorial-team (at) simplywallst.com.
This article by Simply Wall St is general in nature. We provide commentary based on historical data and analyst forecasts only using an unbiased methodology and our articles are not intended to be financial advice. It does not constitute a recommendation to buy or sell any stock, and does not take account of your objectives, or your financial situation. We aim to bring you long-term focused analysis driven by fundamental data. Note that our analysis may not factor in the latest price-sensitive company announcements or qualitative material. Simply Wall St has no position in any stocks mentioned.

