
 Yahoo Lifestyle
 Is United Airlines Holdings, Inc.'s (NASDAQ:UAL) Capital Allocation Ability Worth Your Time?

Today we are going to look at United Airlines Holdings, Inc. (NASDAQ:UAL) to see whether it might be an attractive investment prospect. Specifically, we're going to calculate its Return On Capital Employed (ROCE), in the hopes of getting some insight into the business.
First, we'll go over how we calculate ROCE. Next, we'll compare it to others in its industry. Finally, we'll look at how its current liabilities affect its ROCE.
Return On Capital Employed (ROCE): What is it?
ROCE is a metric for evaluating how much pre-tax income (in percentage terms) a company earns on the capital invested in its business. In general, businesses with a higher ROCE are usually better quality. Overall, it is a valuable metric that has its flaws. Author Edwin Whiting says to be careful when comparing the ROCE of different businesses, since 'No two businesses are exactly alike.
How Do You Calculate Return On Capital Employed?
The formula for calculating the return on capital employed is:
Return on Capital Employed = Earnings Before Interest and Tax (EBIT) ÷ (Total Assets - Current Liabilities)
Or for United Airlines Holdings:
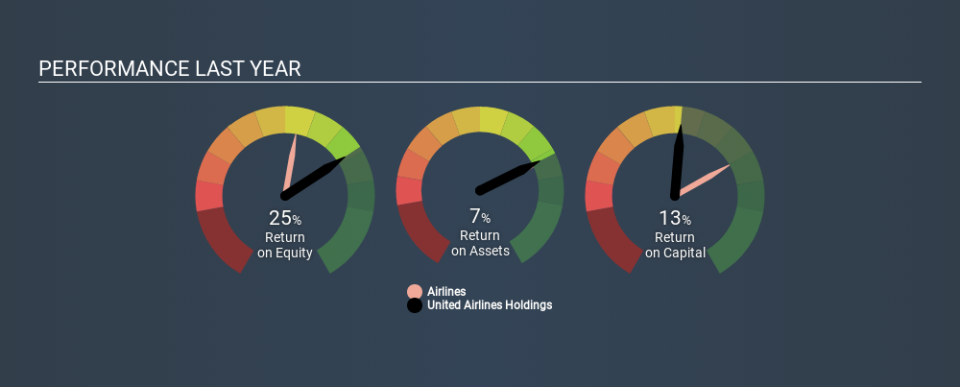
0.13 = US$4.6b ÷ (US$52b - US$16b) (Based on the trailing twelve months to September 2019.)
So, United Airlines Holdings has an ROCE of 13%.
Check out our latest analysis for United Airlines Holdings
Is United Airlines Holdings's ROCE Good?
ROCE is commonly used for comparing the performance of similar businesses. It appears that United Airlines Holdings's ROCE is fairly close to the Airlines industry average of 11%. Independently of how United Airlines Holdings compares to its industry, its ROCE in absolute terms appears decent, and the company may be worthy of closer investigation.
We can see that, United Airlines Holdings currently has an ROCE of 13%, less than the 19% it reported 3 years ago. This makes us wonder if the business is facing new challenges. The image below shows how United Airlines Holdings's ROCE compares to its industry, and you can click it to see more detail on its past growth.
When considering ROCE, bear in mind that it reflects the past and does not necessarily predict the future. ROCE can be misleading for companies in cyclical industries, with returns looking impressive during the boom times, but very weak during the busts. ROCE is, after all, simply a snap shot of a single year. What happens in the future is pretty important for investors, so we have prepared a free report on analyst forecasts for United Airlines Holdings.
What Are Current Liabilities, And How Do They Affect United Airlines Holdings's ROCE?
Liabilities, such as supplier bills and bank overdrafts, are referred to as current liabilities if they need to be paid within 12 months. Due to the way the ROCE equation works, having large bills due in the near term can make it look as though a company has less capital employed, and thus a higher ROCE than usual. To check the impact of this, we calculate if a company has high current liabilities relative to its total assets.
United Airlines Holdings has total liabilities of US$16b and total assets of US$52b. As a result, its current liabilities are equal to approximately 30% of its total assets. United Airlines Holdings has a medium level of current liabilities, which would boost the ROCE.
Our Take On United Airlines Holdings's ROCE
United Airlines Holdings's ROCE does look good, but the level of current liabilities also contribute to that. United Airlines Holdings looks strong on this analysis, but there are plenty of other companies that could be a good opportunity . Here is a free list of companies growing earnings rapidly.
For those who like to find winning investments this free list of growing companies with recent insider purchasing, could be just the ticket.
If you spot an error that warrants correction, please contact the editor at editorial-team@simplywallst.com. This article by Simply Wall St is general in nature. It does not constitute a recommendation to buy or sell any stock, and does not take account of your objectives, or your financial situation. Simply Wall St has no position in the stocks mentioned.
We aim to bring you long-term focused research analysis driven by fundamental data. Note that our analysis may not factor in the latest price-sensitive company announcements or qualitative material. Thank you for reading.

