
 Yahoo Lifestyle
 Is Farmers National Banc Corp’s (NASDAQ:FMNB) ROE Of 10.9% Sustainable?

The content of this article will benefit those of you who are starting to educate yourself about investing in the stock market and want to begin learning the link between company’s fundamentals and stock market performance.
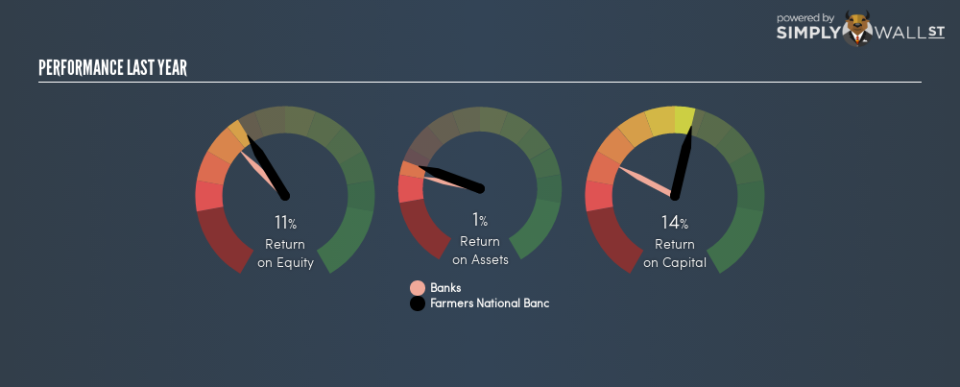
With an ROE of 10.9%, Farmers National Banc Corp (NASDAQ:FMNB) outpaced its own industry which delivered a less exciting 8.2% over the past year. While the impressive ratio tells us that FMNB has made significant profits from little equity capital, ROE doesn’t tell us if FMNB has borrowed debt to make this happen. Today, we’ll take a closer look at some factors like financial leverage to see how sustainable FMNB’s ROE is.
Check out our latest analysis for Farmers National Banc
Peeling the layers of ROE – trisecting a company’s profitability
Return on Equity (ROE) is a measure of Farmers National Banc’s profit relative to its shareholders’ equity. It essentially shows how much the company can generate in earnings given the amount of equity it has raised. In most cases, a higher ROE is preferred; however, there are many other factors we must consider prior to making any investment decisions.
Return on Equity = Net Profit ÷ Shareholders Equity
ROE is measured against cost of equity in order to determine the efficiency of Farmers National Banc’s equity capital deployed. Its cost of equity is 9.8%. Given a positive discrepancy of 1.1% between return and cost, this indicates that Farmers National Banc pays less for its capital than what it generates in return, which is a sign of capital efficiency. ROE can be dissected into three distinct ratios: net profit margin, asset turnover, and financial leverage. This is called the Dupont Formula:
Dupont Formula
ROE = profit margin × asset turnover × financial leverage
ROE = (annual net profit ÷ sales) × (sales ÷ assets) × (assets ÷ shareholders’ equity)
ROE = annual net profit ÷ shareholders’ equity
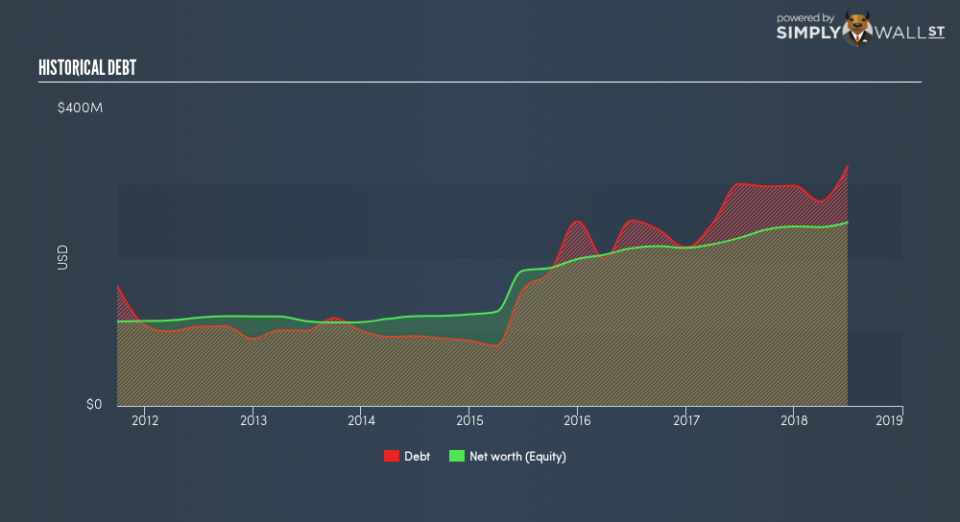
Basically, profit margin measures how much of revenue trickles down into earnings which illustrates how efficient the business is with its cost management. Asset turnover reveals how much revenue can be generated from Farmers National Banc’s asset base. Finally, financial leverage will be our main focus today. It shows how much of assets are funded by equity and can show how sustainable the company’s capital structure is. Since ROE can be artificially increased through excessive borrowing, we should check Farmers National Banc’s historic debt-to-equity ratio. The debt-to-equity ratio currently stands at a balanced 131%, meaning the above-average ROE is due to its capacity to produce profit growth without a huge debt burden.
Next Steps:
ROE is one of many ratios which meaningfully dissects financial statements, which illustrates the quality of a company. Farmers National Banc’s above-industry ROE is encouraging, and is also in excess of its cost of equity. ROE is not likely to be inflated by excessive debt funding, giving shareholders more conviction in the sustainability of high returns. Although ROE can be a useful metric, it is only a small part of diligent research.
For Farmers National Banc, there are three fundamental aspects you should look at:
Financial Health: Does it have a healthy balance sheet? Take a look at our free balance sheet analysis with six simple checks on key factors like leverage and risk.
Valuation: What is Farmers National Banc worth today? Is the stock undervalued, even when its growth outlook is factored into its intrinsic value? The intrinsic value infographic in our free research report helps visualize whether Farmers National Banc is currently mispriced by the market.
Other High-Growth Alternatives : Are there other high-growth stocks you could be holding instead of Farmers National Banc? Explore our interactive list of stocks with large growth potential to get an idea of what else is out there you may be missing!
To help readers see past the short term volatility of the financial market, we aim to bring you a long-term focused research analysis purely driven by fundamental data. Note that our analysis does not factor in the latest price-sensitive company announcements.
The author is an independent contributor and at the time of publication had no position in the stocks mentioned. For errors that warrant correction please contact the editor at editorial-team@simplywallst.com.

