
 Yahoo Lifestyle
 Capital Bancorp (NASDAQ:CBNK) sheds 16% this week, as yearly returns fall more in line with earnings growth
Some Capital Bancorp, Inc. (NASDAQ:CBNK) shareholders are probably rather concerned to see the share price fall 32% over the last three months. In contrast, the return over three years has been impressive. In three years the stock price has launched 136% higher: a great result. After a run like that some may not be surprised to see prices moderate. The fundamental business performance will ultimately dictate whether the top is in, or if this is a stellar buying opportunity.
In light of the stock dropping 16% in the past week, we want to investigate the longer term story, and see if fundamentals have been the driver of the company's positive three-year return.
See our latest analysis for Capital Bancorp
While the efficient markets hypothesis continues to be taught by some, it has been proven that markets are over-reactive dynamic systems, and investors are not always rational. One flawed but reasonable way to assess how sentiment around a company has changed is to compare the earnings per share (EPS) with the share price.
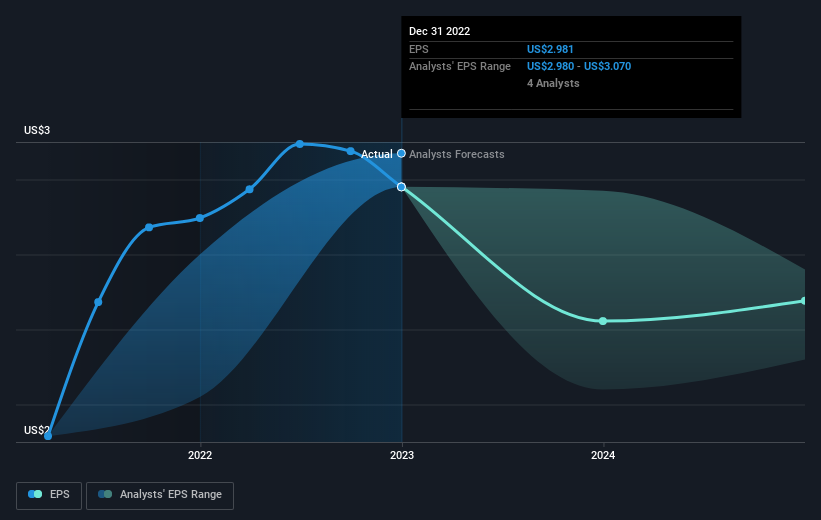
During three years of share price growth, Capital Bancorp achieved compound earnings per share growth of 34% per year. This EPS growth is remarkably close to the 33% average annual increase in the share price. This observation indicates that the market's attitude to the business hasn't changed all that much. Quite to the contrary, the share price has arguably reflected the EPS growth.
The graphic below depicts how EPS has changed over time (unveil the exact values by clicking on the image).
It is of course excellent to see how Capital Bancorp has grown profits over the years, but the future is more important for shareholders. It might be well worthwhile taking a look at our free report on how its financial position has changed over time.
What About Dividends?
When looking at investment returns, it is important to consider the difference between total shareholder return (TSR) and share price return. The TSR is a return calculation that accounts for the value of cash dividends (assuming that any dividend received was reinvested) and the calculated value of any discounted capital raisings and spin-offs. Arguably, the TSR gives a more comprehensive picture of the return generated by a stock. We note that for Capital Bancorp the TSR over the last 3 years was 140%, which is better than the share price return mentioned above. This is largely a result of its dividend payments!
A Different Perspective
Capital Bancorp shareholders are down 29% for the year (even including dividends), falling short of the market return. Meanwhile, the broader market slid about 7.3%, likely weighing on the stock. Fortunately the longer term story is brighter, with total returns averaging about 34% per year over three years. The recent sell-off could be an opportunity if the business remains sound, so it may be worth checking the fundamental data for signs of a long-term growth trend. I find it very interesting to look at share price over the long term as a proxy for business performance. But to truly gain insight, we need to consider other information, too. Case in point: We've spotted 1 warning sign for Capital Bancorp you should be aware of.
If you are like me, then you will not want to miss this free list of growing companies that insiders are buying.
Please note, the market returns quoted in this article reflect the market weighted average returns of stocks that currently trade on US exchanges.
Have feedback on this article? Concerned about the content? Get in touch with us directly. Alternatively, email editorial-team (at) simplywallst.com.
This article by Simply Wall St is general in nature. We provide commentary based on historical data and analyst forecasts only using an unbiased methodology and our articles are not intended to be financial advice. It does not constitute a recommendation to buy or sell any stock, and does not take account of your objectives, or your financial situation. We aim to bring you long-term focused analysis driven by fundamental data. Note that our analysis may not factor in the latest price-sensitive company announcements or qualitative material. Simply Wall St has no position in any stocks mentioned.
Join A Paid User Research Session
You’ll receive a US$30 Amazon Gift card for 1 hour of your time while helping us build better investing tools for the individual investors like yourself. Sign up here

